1. Introduction to Consumer Economics
Have you ever noticed what happens when the latest smartphone drops in price? Suddenly, lines wrap around the block, and online inventory vanishes in minutes. Conversely, when the price of a gallon of gasoline skyrockets, people instinctively consolidate their errands and carpool. This predictable, almost rhythmic human behavior is not coincidental; it is governed by one of the most immutable laws of economics.
To understand how modern markets operate, how businesses set prices, and how global resources are allocated, you must first understand the foundational interaction between buyers and sellers. This interaction relies heavily on understanding what is the price mechanism and how to price goods effectively in a free market. However, the price mechanism cannot function without its two pillars: supply and demand. In this comprehensive guide, we will focus entirely on the consumer’s side of the equation. We will thoroughly define the law of demand and draw a demand curve, breaking down the psychology, mathematics, and real-world business applications of consumer behavior.
2. Defining the Law of Demand
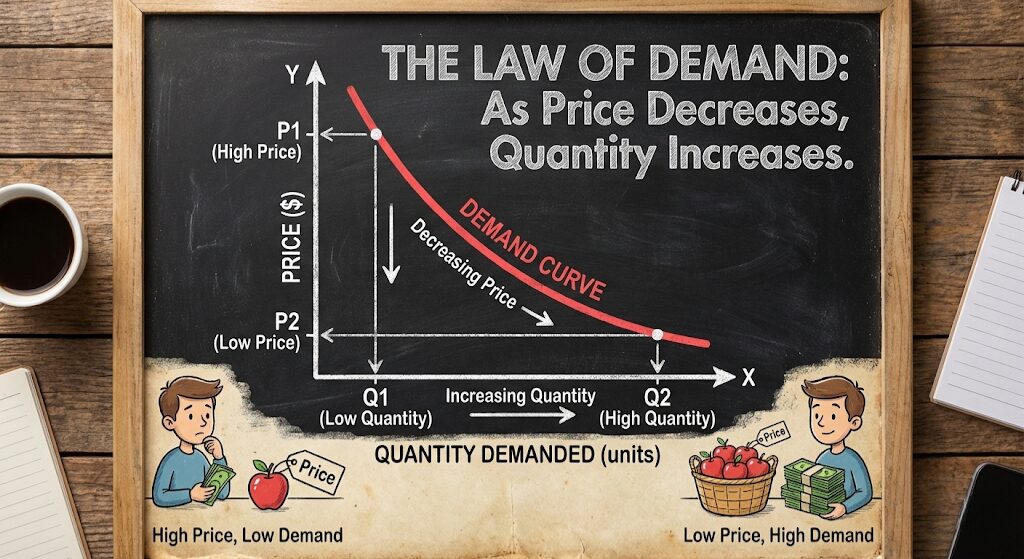
In microeconomics, the Law of Demand is a fundamental principle that states: As the price of a good or service increases, consumer demand for that good or service will decrease, and vice versa. This indicates a strict, inverse relationship between price and quantity demanded.
The “Ceteris Paribus” Assumption
When economists define the law of demand, they append a crucial Latin phrase: Ceteris Paribus, which translates to “all other things being equal.” This means the law of demand only holds true if we assume that only the price is changing. We must assume that consumer income, tastes, preferences, and the prices of competing goods remain completely static during our analysis.
Why is this inverse relationship so universal? It comes down to human nature and resource management. When a product becomes cheaper, the financial sacrifice required to obtain it decreases, allowing more people to enter the market and existing consumers to buy larger quantities. When it becomes expensive, consumers seek alternatives or simply abstain from purchasing.

Master Microeconomic Theory
Stop guessing how markets work. Equip yourself with a top-tier Microeconomics textbook to deeply understand the formulas, psychology, and graphing techniques used by Ivy League economists.
Browse Microeconomics Textbooks3. The Psychology Behind the Law of Demand
The law of demand isn’t just a mathematical equation; it is a direct reflection of human psychology and constraint. Economists attribute the downward-sloping nature of demand to three primary behavioral phenomena:
1. The Law of Diminishing Marginal Utility
“Utility” is an economist’s word for satisfaction or happiness. The law of diminishing marginal utility states that as a person consumes more units of a specific good, the additional (marginal) satisfaction they get from each subsequent unit decreases.
Imagine eating a slice of pizza when you are starving. That first slice provides massive utility. The second slice is good, but slightly less satisfying. By the fifth slice, you might feel sick. Because the utility drops with each additional unit, a consumer will only be willing to buy additional units if the price also drops to match that lowered utility.
2. The Income Effect
Consumers have finite budgets. If you have $50 allocated for coffee this month, and the price of a latte drops from $5 to $2.50, your “real purchasing power” has just doubled. You feel wealthier, even though your actual income hasn’t changed. This income effect allows you to demand a higher quantity of the good.
3. The Substitution Effect
When the price of a good rises, it suddenly becomes relatively more expensive compared to its alternatives (substitutes). If the price of beef skyrockets, consumers will naturally substitute it with chicken or pork, thereby driving down the quantity demanded for beef.
4. How to Draw a Demand Curve (Step-by-Step)
To visualize consumer behavior, economists use a graph called the Demand Curve. To draw one, we first need data. This data is organized into a Demand Schedule—a simple table showing exactly how many units consumers will buy at various price points.
Step 1: Create the Demand Schedule
Let’s use a hypothetical market for gourmet chocolate bars.
| Point | Price per Chocolate Bar ($) | Quantity Demanded (per week) |
|---|---|---|
| A | $10.00 | 100 bars |
| B | $8.00 | 200 bars |
| C | $6.00 | 300 bars |
| D | $4.00 | 400 bars |
| E | $2.00 | 500 bars |
Step 2: Set Up the Axes
In economics, there is a strict convention for graphing demand:
- The Y-axis (Vertical) always represents Price (P).
- The X-axis (Horizontal) always represents Quantity (Q).
Step 3: Plot the Points and Draw the Curve
Take the data from the demand schedule and plot points A, B, C, D, and E on your graph. Once plotted, draw a line connecting these dots. You will see that the line slopes downward from left to right. This visual representation perfectly encapsulates the inverse relationship defined by the law of demand.

Graph Like a Professional
Stop drawing messy charts by hand. Invest in a high-powered graphing calculator to easily plot demand schedules, calculate price elasticity, and solve complex economic equilibrium equations in seconds.
View Graphing Calculators5. Shifts vs. Movements Along the Curve
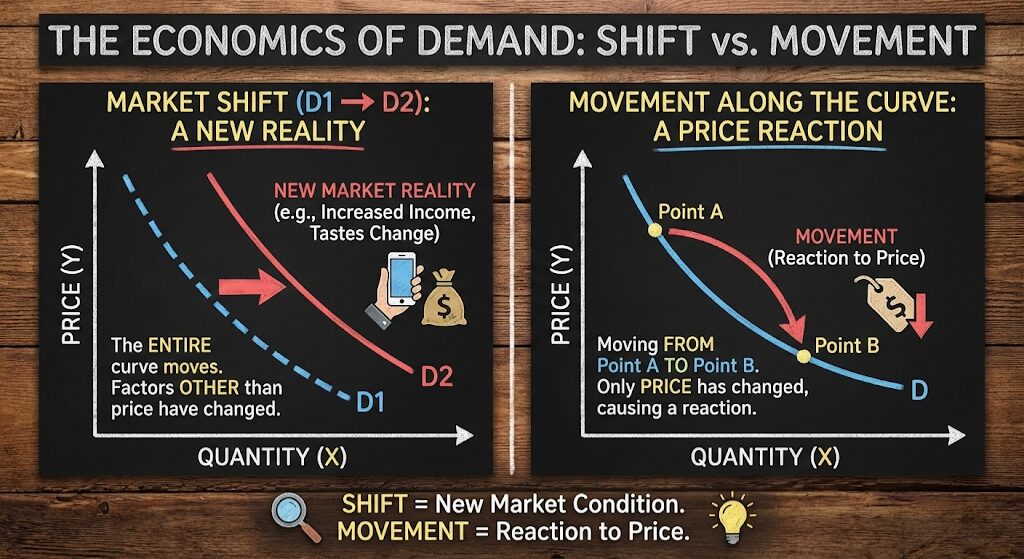
One of the most common mistakes students and business owners make is confusing a change in quantity demanded with a change in demand. They sound similar, but on a graph, they are entirely different events.
Movement Along the Curve
A movement occurs ONLY when the price of the good itself changes. If chocolate bars go on sale from $6 to $4, we simply slide our finger down the existing curve from Point C to Point D. The curve itself does not move. This is called a change in Quantity Demanded.
Shift of the Entire Curve
A shift occurs when the price of the good stays exactly the same, but an external factor (a non-price determinant) changes. If a medical study proves chocolate cures the common cold, people will want more chocolate even if the price stays at $6. The entire curve shifts to the right. This is called a change in overall Demand.
6. Non-Price Determinants of Demand (The Shifters)
If price causes a movement, what causes a shift? When we drop the ceteris paribus assumption, several external macroeconomic and microeconomic variables come into play. These are the variables that marketing teams and economists monitor obsessively.
- 1. Changes in Income: If consumers get richer, demand shifts. For Normal Goods (like steak or vacations), a rise in income shifts demand to the right. For Inferior Goods (like instant noodles or cheap fast food), a rise in income shifts demand to the left, as consumers can now afford better alternatives. This ties heavily into the broader macroeconomic picture. If you want to understand how a nation’s total income is calculated, read our guide on how to understand what is national income.
- 2. Prices of Related Goods:
- Substitutes: Goods used in place of one another (Coke vs. Pepsi). If the price of Coke skyrockets, the demand curve for Pepsi shifts to the right.
- Complements: Goods used together (Printers and Ink). If the price of printers drops, people buy more printers, which shifts the demand curve for ink to the right.
- 3. Tastes and Preferences: Cultural trends, viral marketing, or new scientific data can instantly shift demand. If a celebrity endorses a specific sneaker, its demand curve shifts right.
- 4. Consumer Expectations: If people expect the price of housing to skyrocket next year, they will rush to buy houses today, shifting current demand to the right.
- 5. Market Demographics: An increase in population, or a shift in the age of a population (e.g., an aging baby boomer generation), will shift the demand curve for relevant products (e.g., healthcare services) to the right.
7. Exceptions to the Law of Demand
Are there ever situations where a price increase actually increases the quantity demanded? Yes. While rare, these anomalies violate the standard law of demand and result in an upward-sloping demand curve.
| Exception Type | Definition & Mechanism | Real-World Example |
|---|---|---|
| Giffen Goods | Extreme inferior goods where the income effect dwarfs the substitution effect. When the price of a staple food rises, impoverished consumers have no money left for premium foods, forcing them to buy more of the staple to survive. | Potatoes or rice in historically impoverished agrarian societies during a famine. |
| Veblen Goods | Luxury items sought precisely because they are expensive. The high price gives the good exclusivity and status. Lowering the price would destroy the “snob appeal,” reducing demand. | Rolex watches, Birkin bags, limited-edition sports cars, or haute couture fashion. |
| Speculative Markets | In financial markets, rising prices can trigger FOMO (Fear Of Missing Out). Buyers purchase more as the price rises, anticipating they can sell it for even more tomorrow. | Stock market bubbles, Cryptocurrency runs, or real estate booms. |

Turn Theory Into Profit
Knowing how to draw a demand curve is just the beginning. Learn how modern corporations use big data, elasticity models, and behavioral economics to set prices and maximize revenue.
Explore Business Pricing Strategy Books8. Understanding Elasticity of Demand
While the law of demand tells us the direction consumers will react (price goes up, quantity goes down), it does not tell us the magnitude of the reaction. This is where Price Elasticity of Demand (PED) comes in.
Elasticity measures how sensitive consumers are to a price change. Visually, this changes how you draw the demand curve:
- Elastic Demand (Flat Curve): Consumers are highly sensitive. A small 5% increase in price might lead to a massive 20% drop in demand. This happens with non-essential luxury items or goods with many substitutes (like a specific brand of cereal).
- Inelastic Demand (Steep Curve): Consumers are not very sensitive. A massive 20% increase in price might only reduce demand by 2%. This happens with necessities, life-saving medications (like insulin), or addictive substances (like tobacco).
9. The Law of Demand in Production and Macroeconomics
Demand does not exist in a vacuum; it dictates the supply side of the economy. When the demand curve for a product shifts to the right, businesses scramble to meet the new consumer desire to capture profit.
To meet this new demand, businesses must acquire resources. If you look at what is production and its 4 most important factors (Land, Labor, Capital, and Entrepreneurship), you will realize that consumer demand essentially dictates how a nation utilizes its resources. If demand for electric vehicles surges, land is reallocated for lithium mining, and labor is reallocated toward battery engineering.
However, businesses cannot scale up instantly. Economists use specific terminology to define the term short-run production. In the short run, a factory can only hire more workers (variable factor) to meet rising demand, while their factory size (fixed factor) remains unchangeable. The demand curve dictates whether it is worth the financial risk to build a second factory in the “long run.” By aggregating these microeconomic production decisions, we build the broader macroeconomic health of a country, forming the components of national income.
10. Real-World Business Applications
Understanding how to define the law of demand and draw a demand curve is the bedrock of modern corporate pricing strategies. Businesses do not guess their prices; they model consumer demand.
Dynamic Pricing in Action
Think about rideshare apps like Uber or airline ticketing systems. These companies utilize algorithms to constantly draw and redraw demand curves in real-time. During a rainstorm (an external shock), consumer demand for rides shifts violently to the right. The algorithm institutes “surge pricing,” moving up the new demand curve to find the exact price point that clears the market, maximizing profit while rationing the limited supply of drivers.
11. Conclusion: The Blueprint of Commerce
The Law of Demand is far more than a theoretical concept confined to college textbooks; it is the blueprint of global commerce. By understanding that consumers will instinctively maximize their utility based on price, businesses can predict market reactions, governments can forecast the impact of taxes, and individuals can make more rational financial decisions.
Whether you are sketching a demand curve on a napkin to price a new product or programming an AI to optimize airline ticket sales, the underlying mathematical truth remains the same: as price falls, demand rises. Master this curve, and you master the foundational language of the market.
Explore More Economic Strategies at Edmics