
How to Read a Balance Sheet (Step by Step, With Real Examples)
A line-by-line walkthrough of every section of a balance sheet — what the numbers mean, how they connect, and how to spot trouble before it shows up anywhere else.
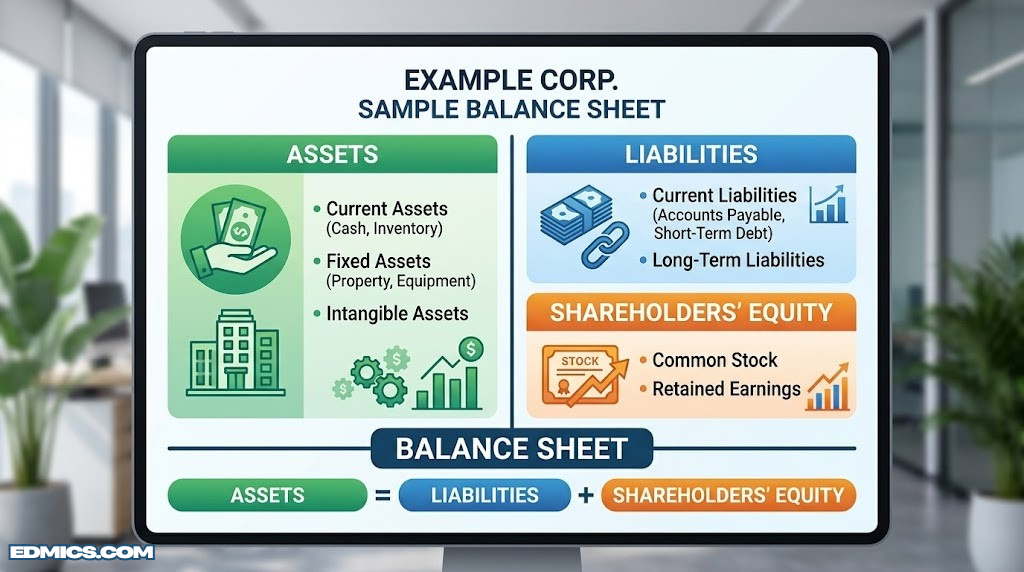
What a Balance Sheet Actually Tells You
Most people’s first encounter with a balance sheet is intimidating for a strange reason: it doesn’t look like a story. An income statement reads like a narrative — revenue came in, costs went out, profit (or loss) is what’s left. A cash flow statement reads like a diary of where money physically moved. A balance sheet, by contrast, looks like a snapshot of a filing cabinet. Three sections, a bunch of numbers, and an instruction at the bottom that two of the totals have to match. No verbs. No plot.
But that “snapshot” framing is exactly why the balance sheet is so useful, and why learning to read one is one of the highest-leverage financial skills you can pick up — whether you’re running a small business, evaluating a company before investing, or just trying to understand your own household’s net worth in a more structured way. A balance sheet answers one deceptively simple question: as of this exact date, what does this entity own, what does it owe, and what’s left over for the owners? Everything else — every ratio, every red flag, every “is this company in trouble” judgment call — is built on top of that one question.
If you’ve already read our beginner’s guide to balance sheets, you’ll recognize the basic shape: Assets on one side (or at the top), Liabilities and Shareholders’ Equity on the other (or below). This guide goes further. Instead of just defining the categories, we’re going to walk through the document the way an experienced analyst actually does — section by section, line by line, with the questions you should be asking at each stop and the warning signs that tell you to slow down and look closer.
It helps to understand who actually reads these documents and why, because the “why” shapes what you should be looking for. Investors read balance sheets to judge whether a company can survive a downturn and whether it’s using its resources efficiently. Lenders read them to judge whether a borrower can repay debt — and whether there’s enough hard collateral if things go wrong. Auditors read them as the central object of the entire audit process; if you’ve ever wondered what auditors are actually checking, our piece on the purposes and advantages of an audit walks through exactly that. Business owners read their own balance sheet to understand whether the business is building wealth or quietly draining it, even while the income statement looks fine.
That last point deserves emphasis, because it’s the single biggest reason people get blindsided. A business can be profitable on paper — strong revenue, healthy margins, a flattering income statement — and still be in serious danger, because all of that profit is tied up in unpaid customer invoices, slow-moving inventory, or assets that don’t generate cash. The income statement tells you whether the business made money on transactions during a period. The balance sheet tells you whether that money actually turned into something solid — cash, equipment, paid-down debt — or whether it’s still sitting out there as a promise. Reading a balance sheet well means you stop taking “we were profitable this quarter” at face value and start asking “okay, but where did that profit actually go?”
One more framing point before we get into the mechanics: a balance sheet is always dated “as of” a specific day — not “for the month of” or “for the year ended” like an income statement. This is the most common source of confusion for beginners, and it matters because it means a balance sheet is a single freeze-frame, not a video. Two balance sheets from different dates, placed side by side, is where the real insight starts — which is exactly what we’ll cover in Step 8. For now, just hold onto this: every number on the page describes the world at one specific moment, and your job is to figure out what that moment is telling you.
By the end of this guide, you’ll be able to pick up almost any balance sheet — a small business’s, a public company’s annual report, even your own personal net-worth statement — and work through it methodically: orient yourself, read each section with the right questions in mind, confirm the equation balances, calculate the handful of ratios that matter most, and spot the handful of red flags that experienced readers check automatically. None of it requires an accounting degree. It just requires knowing what each piece of the page is actually for, which is what the rest of this guide is going to give you.
The Accounting Equation: The Logic Behind Every Balance Sheet
Before you read a single line item, it helps to understand the one rule that the entire balance sheet is built around — because once this rule “clicks,” the rest of the document stops feeling like a list of arbitrary numbers and starts feeling like a structure with a built-in self-check.
That rule is the accounting equation:
Assets = Liabilities + Owner's (or Shareholders') Equity
If you want the deeper history and derivation of this formula, we cover it thoroughly in our dedicated piece on the accounting equation. For our purposes here, what matters is the intuition: every single thing a business owns (its assets) had to be paid for by something. There are only two possible sources of that money — someone the business owes (a liability, like a loan or unpaid bill) or the owners themselves (equity, including money they put in directly and profits the business has kept rather than paid out).
Put another way: liabilities and equity tell you where the money for the assets came from. Assets tell you what that money currently looks like, in physical or financial form. A balance sheet is essentially answering the same question from two different directions, and because both directions are describing the same underlying reality, the two totals must match. If they don’t, something is wrong — either a transaction was recorded incorrectly, or something is missing entirely.
This self-checking property is the direct result of double-entry bookkeeping, the system that underlies essentially all modern accounting. If the phrase “debits and credits” makes your eyes glaze over, our complete guide to double-entry bookkeeping breaks it down without the jargon — but the short version is that every transaction is recorded in at least two places, in a way that keeps the equation balanced automatically. When you buy equipment with cash, one asset (cash) goes down while another asset (equipment) goes up by the same amount — the equation never even notices, because both sides of the change happened on the assets side. When you take out a loan to buy that same equipment, an asset (equipment) goes up and a liability (loan payable) goes up by the same amount — again, balanced.
Why does this matter for reading a balance sheet, as opposed to preparing one? Because it gives you a built-in sanity check that takes about ten seconds to run, and which we’ll formalize in Step 6. If Total Assets doesn’t equal Total Liabilities plus Total Equity, you’re either looking at a document that has an error in it, or — more often — you’re looking at an incomplete extract that’s missing a section. Either way, that’s useful information before you go any further.
There’s a second, quieter benefit to internalizing the accounting equation: it tells you what each section of the balance sheet is for, conceptually, before you’ve read a single line item inside it.
- Assets — everything of value the business controls and can use to generate future benefit: cash, inventory, equipment, buildings, amounts owed to it by customers, and more.
- Liabilities — everything the business owes to outside parties: loans, unpaid bills, taxes owed, deferred obligations.
- Equity — the residual claim that belongs to the owners after every outside obligation is accounted for. It’s often described as “what’s left if you sold everything and paid off every debt” — though in practice it’s a recorded accounting figure built from contributed capital and retained earnings, not a real-time market valuation.
If you’re working through this guide alongside our golden rules of accounting, you’ll notice they’re really just operational versions of this same equation — rules that tell a bookkeeper which “side” of a transaction goes where, so that the equation stays balanced no matter how many transactions happen in a day, a month, or a year. Once that’s intuitive, every section that follows in this guide will make a lot more sense, because you’ll know not just what each line item is, but why it lives where it lives.
Orient Yourself: Header, Dates, and Comparative Columns
Every good reading of a balance sheet starts before you even get to the numbers — it starts with the header. Skipping this part is the single most common reason people misread a balance sheet, because the header tells you what you’re looking at, when it applies, and how the numbers are scaled. Get any of those three wrong and everything downstream becomes meaningless, no matter how carefully you analyze the line items.
A balance sheet header tells you the entity, the exact reporting date, and how many comparative columns you’re working with — read all three before the numbers.
First, confirm the entity. This sounds obvious, but in larger companies the balance sheet you’re looking at might be “consolidated” (combining a parent company and its subsidiaries into one set of figures) or it might be for a single subsidiary only. The difference matters enormously if you’re comparing two companies — a consolidated balance sheet for a parent company will include assets and liabilities that a stand-alone subsidiary’s balance sheet won’t, and vice versa. If the header doesn’t say “consolidated,” assume it might not be, and check.
Second, and most importantly: lock in the reporting date. As we touched on in the introduction, a balance sheet is dated “as of” a specific day — typically the last day of a fiscal quarter or fiscal year. Unlike an income statement, which covers a span of time (“for the year ended…”), a balance sheet is a freeze-frame. Two practical implications follow from this:
- If a company’s fiscal year doesn’t match the calendar year, the “as of” date might fall in an unexpected month. This is normal and doesn’t mean anything is wrong — it just means you need to track which fiscal period you’re in when comparing companies with different fiscal calendars.
- A balance sheet can look dramatically different just a few weeks before or after the date shown, especially for seasonal businesses. A retailer’s balance sheet “as of” the day after a major shopping season will show very different inventory and cash levels than one from a few months earlier. This isn’t deception — it’s just the nature of a snapshot — but it means you should never assume the reporting date represents a “typical” day for the business.
Third, identify the comparative columns. Most balance sheets — and this is a requirement for public companies under most accounting frameworks — show at least two periods side by side: the current reporting date and the equivalent prior-period date (often the same date one year earlier, or the prior fiscal year-end). This comparative layout is not decoration. It’s the raw material for Step 8, where we’ll talk about trend analysis. As you read through the rest of this guide, get in the habit of glancing at both columns for every line item, not just the current one — a single number tells you “what,” but two numbers next to each other start telling you “which direction.”
Finally, check the units. Larger companies almost always state their balance sheets “in thousands” or “in millions” of their reporting currency, usually noted in small print near the header or in the notes to the financial statements. Misreading a line item that says “1,250” as one thousand two hundred fifty dollars when it actually means 1,250 thousand — i.e., $1.25 million — is an easy mistake, and it can throw off every ratio you calculate later by three orders of magnitude. It takes ten seconds to check. Do it every time, especially when you’re looking at a company’s balance sheet for the first time.
Once you’ve confirmed the entity, the date, the comparative structure, and the units, you’ve done something that a surprising number of people skip entirely — and you’ve set yourself up to read every section that follows correctly the first time, rather than having to backtrack. With that groundwork in place, let’s move into the first major section of the page itself: assets, starting with the most liquid ones.

Recommended Reading
If the header-and-structure conventions in this section feel new, a plain-language accounting reference book is one of the best low-cost investments you can make before diving into real financial statements.
Browse Beginner Accounting BooksReading Current Assets Line by Line
With the header sorted out, the first major block of numbers you’ll encounter is Current Assets — and the order they’re listed in is itself a piece of information. Current assets are conventionally listed in order of liquidity: how quickly and easily each item could, in theory, be converted into cash without a significant loss of value. That ordering isn’t arbitrary, and reading it as a “ladder” rather than a flat list makes the section much easier to interpret.
Current assets are listed from most liquid (cash) to least liquid (prepaid expenses) — the order itself tells you how quickly each item could become cash.
Cash and Cash Equivalents sits at the top for a reason: it’s already cash, or so close to it (think Treasury bills maturing in days, or money market funds) that the distinction barely matters. This line item is the closest thing on the entire balance sheet to “ground truth.” When evaluating a company’s resilience, a healthy cash balance relative to its monthly operating costs is one of the first things experienced readers check — it’s the buffer that determines how long a business can survive a revenue shock before it has to make hard decisions.
Short-Term Investments / Marketable Securities comes next — things like short-term bonds or certificates of deposit that the company could sell relatively quickly if needed, but which aren’t literally cash. Companies sometimes park excess cash here to earn a bit of return while keeping it accessible. For most small businesses this line won’t exist at all, which is completely normal.
Accounts Receivable, net represents money that customers owe the business for goods or services already delivered — invoices sent but not yet paid. The word “net” is doing important work here: it means the figure has already been reduced by an estimate of receivables the company doesn’t expect to actually collect (sometimes called an “allowance for doubtful accounts”). A growing receivables balance can mean healthy sales growth — or it can mean the company is struggling to collect from customers and is effectively extending more and more interest-free credit. The way to tell the difference is to compare the rate of growth in receivables to the rate of growth in revenue (which you’d find on the income statement); if receivables are growing meaningfully faster than sales, that’s worth investigating. This is also where the relationship between accounts payable and accounts receivable becomes relevant — they’re two sides of the same coin, just from opposite perspectives.
Inventory is goods the business has on hand — raw materials, work-in-progress, or finished goods ready to sell. Inventory sits lower on the liquidity ladder because converting it to cash requires an extra step (a sale) that isn’t guaranteed to happen quickly or at full value. A large inventory balance relative to sales can signal either a strategic stockpiling decision (e.g., ahead of a known demand spike) or a warning sign that products aren’t moving — and the latter often shows up as inventory write-downs on the income statement later. We’ll come back to inventory turnover specifically in Step 7, when we get into ratios.
Prepaid Expenses and Other Current Assets rounds out the section — amounts the business has already paid for but hasn’t “used” yet, like a year’s insurance premium paid upfront in January. These are technically assets because they represent future economic benefit (you won’t have to pay for that coverage again), but they’re the least “cash-like” item in the section, since they typically can’t be converted back into cash at all — only consumed over time.
Add these up and you get Total Current Assets — a subtotal that matters in its own right, because it’s the numerator in one of the most widely used ratios on the entire page (the current ratio, covered in Step 7). Once you’ve worked through this section, you’ve effectively answered the question: “if this business needed to raise cash quickly, what does it have to work with, and how quickly could each piece realistically convert?” That’s exactly the lens to carry into the next section, where the assets get a lot less liquid — and a lot more permanent.
Reading Non-Current (Long-Term) Assets
Below Total Current Assets, you’ll find a second block, usually labeled Non-Current Assets or Long-Term Assets. The defining feature of everything in this section is time horizon: these are resources the business expects to hold and use for more than one year, rather than convert to cash in the near term. The mindset shift you need here is significant — in the current assets section, you were thinking about liquidity. In this section, you need to start thinking about productive capacity and how cost gets allocated over time.
The largest line item in this section, for most businesses that own physical operations, is Property, Plant & Equipment (PP&E) — buildings, machinery, vehicles, computers, and similar long-lived physical assets used in the business. Here’s where most beginners get tripped up: PP&E on the balance sheet is almost never shown at what it would cost to buy today, and it’s almost never shown at its original purchase price either. It’s shown net of accumulated depreciation, and understanding that calculation is essential to reading this section correctly.
Net Book Value = Gross Cost − Accumulated Depreciation. Intangible assets sit alongside PP&E but follow different rules for how (or whether) their value is reduced over time.
Here’s the underlying logic: when a business buys a piece of equipment that will last, say, ten years, accounting principles say it shouldn’t record the entire cost as an expense in year one — because the equipment will be helping generate revenue across all ten years, not just the first. Instead, the cost is spread out (“depreciated”) over the asset’s useful life, with a portion charged to the income statement each year. Accumulated Depreciation is the running total of all those portions charged so far, across the asset’s entire life to date.
On the balance sheet, you’ll typically see PP&E presented one of two ways: either as a single net figure (with the gross cost and accumulated depreciation broken out in the notes), or as three lines — gross cost, accumulated depreciation as a negative number, and the net result. Either way, the net figure (often called “net book value” or “net PP&E”) is what flows into Total Assets. If you want the full mechanics of how depreciation gets calculated and recorded — including the different methods companies can choose — our dedicated guide on depreciation in accounting covers it in depth.
Why does this matter for reading the balance sheet? Two reasons. First, net book value is an accounting figure, not a market value — a building that’s been almost fully depreciated on the books might still be worth a great deal if sold, while specialized equipment that’s “worth” a large net book value might be nearly impossible to sell for that amount in practice. Second, the ratio of accumulated depreciation to gross cost tells you something about the “age” of a company’s asset base — a high ratio suggests assets are old and may need replacing soon (a future cash outflow to watch for), while a low ratio suggests a relatively young, recently-invested asset base.
Below PP&E, you’ll often find Intangible Assets — things you can’t physically touch but which have real economic value: patents, trademarks, customer relationships, software, and (for companies that have made acquisitions) Goodwill. Goodwill specifically represents the amount a company paid for an acquisition above and beyond the fair value of the identifiable assets it acquired — essentially, a premium paid for things like brand reputation, expertise, or market position that don’t show up as a separate line item of their own. Unlike PP&E, most intangible assets with finite lives are “amortized” (the intangible-asset equivalent of depreciation) over their useful lives, while goodwill and certain other intangibles with indefinite lives are instead tested periodically for “impairment” — and if their value has dropped, that drop hits the income statement directly, sometimes in large, headline-grabbing amounts.
Finally, you may see a line for Other Long-Term Assets — a catch-all for items that don’t fit neatly elsewhere, such as long-term deposits, long-term notes receivable, or deferred tax assets (amounts a company expects to recover as reduced taxes in future years). Individually these are often small, but it’s worth a quick glance — a sudden, large jump in “other” anything on a balance sheet is a classic signal to dig into the footnotes, since “other” is sometimes where less-flattering items get tucked.
Add Total Current Assets and Total Non-Current Assets together, and you arrive at Total Assets — the figure at the very bottom of the left-hand (or top) side of the page, and the number that the entire right-hand side has to match. With assets fully mapped out, it’s time to flip to the other side of the equation and start working through what the business owes.
Reading Current Liabilities
We now cross from the asset side of the equation to the obligation side, and the framing shifts again. In the assets sections, you were asking “how quickly could this become cash?” In the liabilities sections, the question becomes “how soon does this need to be paid with cash?” Current Liabilities are obligations the business expects to settle within one year — and, just as with current assets, the items inside this section are typically ordered with the most pressing, routine obligations first.
Current liabilities are obligations due within twelve months — they’re what current assets effectively have to “compete” with for cash.
Accounts Payable typically leads the section: amounts the business owes to its suppliers and vendors for goods or services already received but not yet paid for — the mirror image of accounts receivable on the asset side, just from the other party’s perspective. We touched on this relationship earlier; if you want a fuller comparison of how the two interact across a company’s operating cycle, our piece on accounts payable vs. accounts receivable lays it out side by side. A growing accounts payable balance isn’t automatically bad — it can simply mean a company is using supplier credit terms effectively — but a payables balance that’s growing much faster than purchase volume can be a sign that a company is delaying payments because cash is tight.
Accrued Expenses (sometimes called “accrued liabilities”) cover costs the business has incurred but hasn’t yet paid or been formally invoiced for — a classic example is wages earned by employees in the final days of a reporting period but not paid until the following period’s payday. This line item exists because of accrual accounting: expenses are recognized when they’re incurred, not necessarily when cash actually changes hands. This is the same principle, working in the opposite direction, that creates accounts receivable on the asset side when revenue is earned before cash is collected.
Short-Term Debt / Notes Payable represents borrowings the company expects to repay within the year — this might be a revolving line of credit, a short-term loan, or commercial paper for larger companies. Current Portion of Long-Term Debt is a related but distinct concept worth understanding clearly: if a company has a five-year loan, the portion of that loan’s principal due to be repaid within the next twelve months gets reclassified out of long-term liabilities and into this current liabilities line — even though the loan itself is “long-term” debt. This reclassification happens every single reporting period as the loan amortizes, and it’s exactly the kind of detail that makes the current ratio (Step 7) move slightly from period to period even when nothing dramatic has happened to the business.
You may also see Deferred Revenue (also called “unearned revenue”) in this section — money the company has already received from customers for goods or services it hasn’t delivered yet. This is a liability, even though cash has come in, because the company still owes the customer something: the product, the service, or a refund. Subscription businesses, software companies, and anyone selling annual contracts paid upfront will often have a meaningful deferred revenue balance, and watching how it trends over time can tell you a lot about the health of a subscription business’s bookings — independent of what the income statement shows for “revenue” in any given period, since revenue gets recognized gradually as the obligation is fulfilled.
Finally, Income Taxes Payable and any other miscellaneous short-term obligations round out the section. Add everything up, and you get Total Current Liabilities — a figure that, paired with Total Current Assets from Step 2, gives you the current ratio in Step 7 and tells you, in a single number, how comfortably a company’s near-term obligations are covered by its near-term resources.

Track Your Own Numbers
Whether you’re reconciling payables manually or just keeping a running log for a small business, a dedicated ledger book makes it far easier to see accruals and short-term obligations at a glance before they hit the books.
Browse Ledger & Journal BooksReading Long-Term Liabilities
Beneath Total Current Liabilities sits the Long-Term Liabilities (or “Non-Current Liabilities”) section — obligations that stretch beyond the one-year horizon. If current liabilities are about near-term cash pressure, this section is about a company’s longer-term capital structure: how much of its operations are financed through debt that won’t come due for years, and what kinds of future commitments it’s already locked into.
Long-term liabilities extend past the one-year mark — the further the bar reaches, the longer the company has before that obligation needs to be settled.
Long-Term Debt / Bonds Payable is usually the headline item here — the principal balance of loans, mortgages, or bonds that mature more than a year out (remember, the portion due within a year has already been carved out into current liabilities, as we discussed in Step 4). When evaluating this line, it’s worth thinking about why the debt exists. Debt taken on to fund productive long-term assets — a new factory, equipment that will generate years of revenue — is a fundamentally different story than debt taken on to cover operating losses or to pay dividends. The balance sheet alone won’t always tell you which is which, but combined with a look at how Total Assets and Retained Earnings (Step 6) have trended over the same period, you can usually piece together the story.
Deferred Tax Liabilities arise from timing differences between how income is recognized for financial reporting purposes versus tax purposes. A common cause is depreciation: companies often use faster depreciation methods for tax purposes than for financial reporting, which reduces taxable income (and taxes paid) in early years — creating a liability that represents taxes the company will effectively “catch up on” in later years. This is a real obligation, but it’s also one that, for healthy growing companies, can persist or even grow indefinitely as new assets are continually added — so a large deferred tax liability balance isn’t automatically a red flag the way a large overdue accounts payable balance might be.
Long-Term Lease Liabilities have become a much more visible line item on balance sheets in recent years, following accounting standard updates that require companies to record most operating leases — office space, retail locations, equipment leases — as both a “right-of-use” asset and a corresponding lease liability, split between current and long-term portions. Before these updates, many of these obligations were disclosed only in footnotes rather than appearing directly on the balance sheet. If you’re comparing a company’s balance sheet from before and after these changes took effect, you may see what looks like a sudden jump in both assets and liabilities — this is usually a presentation change rather than a sign that the company suddenly took on new obligations overnight.
You may also encounter Pension and Post-Retirement Obligations for companies (often larger, more established ones) that sponsor defined-benefit pension plans — representing the estimated future amounts owed to retirees, net of the assets set aside to fund those payments. These figures are based on actuarial assumptions (life expectancy, expected investment returns, discount rates) that can swing significantly with relatively small changes in those assumptions, which is why pension-related figures often come with extensive footnote disclosures.
Add Total Current Liabilities and Total Long-Term Liabilities together, and you arrive at Total Liabilities — everything the business owes to parties outside the ownership group, regardless of when it’s due. With both halves of the “where did the money come from” story now complete — debt on one side — there’s exactly one piece left: what belongs to the owners. That’s where we’re headed next, and it’s also where we’ll run the most important check on the entire page.
Reading Shareholders’ Equity & Confirming the Equation Balances
We’ve arrived at the final major section: Shareholders’ Equity (called “Owner’s Equity” or “Members’ Equity” depending on the legal structure of the business). Conceptually, we covered this back in our discussion of the accounting equation — equity is the residual claim that belongs to the owners once every external obligation has been accounted for. Now it’s time to see what that residual is actually made of, line by line, and then run the single most important check on the whole document.
Common Stock (sometimes split into “par value” and other components) represents the nominal value assigned to shares issued to investors — for many companies this is a very small number that bears little relationship to the actual amount investors paid, because of how par value is set legally. The real story of how much investors contributed usually sits in the next line.
Additional Paid-In Capital (APIC) captures the amount investors paid for shares above that par value — in most cases, this is where the bulk of the money a company has raised from issuing stock actually shows up. Together, Common Stock and APIC represent the total capital that owners have directly contributed to the business in exchange for ownership shares.
Retained Earnings is, for most companies, the most important line in this entire section — and it’s the single biggest bridge between the balance sheet and the income statement. Retained earnings represents the cumulative total of all the profits (or losses) the company has generated over its entire history, minus any amounts paid out to shareholders as dividends. Every period, that period’s net income (or loss) — the bottom line of the income statement — flows into retained earnings, increasing it (if profitable) or decreasing it (if a loss). This is precisely why a company can be consistently profitable and steadily build retained earnings even while individual quarters look noisy on the income statement; retained earnings is the long-run scoreboard. If you haven’t worked through how the income statement itself is structured, our income statement guide is the natural companion to this section, since the two statements are connected at exactly this point.
You may also encounter Treasury Stock — a contra-equity account (meaning it reduces total equity rather than adding to it) representing shares the company has repurchased from the open market and is holding rather than retiring. When a company buys back its own stock, it’s effectively returning capital to (some) shareholders, which is why this line subtracts from equity. And Accumulated Other Comprehensive Income (AOCI) — often a smaller line, but one that can swing meaningfully for companies with significant foreign operations or large investment portfolios — captures certain gains and losses (like foreign currency translation effects or unrealized gains on certain investments) that bypass the income statement entirely and flow directly into equity.
Add up Common Stock, APIC, Retained Earnings, and any other equity components (subtracting Treasury Stock), and you get Total Shareholders’ Equity. Now for the moment this entire guide has been building toward.
Total Assets must equal Total Liabilities plus Total Shareholders’ Equity. If the scale doesn’t balance, look for a missing section, a rounding issue, or a misclassified line item before drawing any conclusions.
This is the check we set up conceptually back in our discussion of the accounting equation: Total Assets should equal Total Liabilities plus Total Shareholders’ Equity, exactly. On a properly prepared balance sheet, this will always be true — it’s not a coincidence or a target the company is trying to hit; it’s a structural property of double-entry bookkeeping itself. If you add up everything correctly and the two sides don’t match, the most likely explanations, roughly in order of how often they actually happen, are: (1) you’re looking at a partial extract that’s missing a line item or an entire section, (2) there’s a rounding difference from how figures were presented (rare, and usually off by only $1 in thousands-scale statements), or (3) — much less commonly, but worth knowing about — there’s an actual error in the underlying records.
Running this check takes less than a minute, and experienced analysts do it almost automatically, the same way you might glance at a receipt total before walking away from a register. It’s not about distrusting the company — it’s about confirming you’re working with a complete, internally consistent picture before you start drawing conclusions from it. With that confirmation in hand, you’re ready for the part of this guide where the balance sheet stops being a static snapshot and starts becoming a diagnostic tool: turning these raw totals into the ratios that tell you whether a company is financially healthy.
Turning Numbers into Insight: Key Ratios
A balance sheet on its own gives you raw totals. Ratios turn those totals into relationships — and relationships are what actually tell you whether a company is in good shape. A current ratio of “2” means something specific regardless of whether a company’s total assets are $50,000 or $50 million, which is exactly why ratios let you compare businesses of wildly different sizes on a level footing. This step covers the handful of ratios that get the most use, what each one is really asking, and — just as importantly — what they can’t tell you on their own.
Every ratio in this section is built directly from totals you’ve already located in Steps 2 through 6 — the work is in combining them, not finding new numbers.
The Current Ratio (Total Current Assets ÷ Total Current Liabilities) is the most widely cited liquidity measure, and it directly answers a question we’ve been building toward since Step 2: for every dollar of obligations coming due within a year, how many dollars of resources does the company have that could plausibly become cash within the same window? A ratio above 1.0 means current assets exceed current liabilities; a ratio meaningfully below 1.0 can be a warning sign, though context matters enormously — some business models (certain retailers, for instance) operate comfortably with lower current ratios because their inventory turns into cash very quickly.
The Quick Ratio (sometimes called the “acid-test ratio”) tightens the current ratio by removing inventory and prepaid expenses from the numerator — leaving only cash, marketable securities, and receivables. The logic: if a company needed to cover its near-term obligations right now, inventory might not sell quickly enough to help, so a stricter test excludes it. A large gap between a company’s current ratio and quick ratio usually means inventory makes up a big chunk of current assets — not inherently bad, but worth understanding in the context of the business.
The Debt-to-Equity Ratio (Total Liabilities ÷ Total Shareholders’ Equity) shifts focus from short-term liquidity to long-term capital structure: for every dollar that belongs to the owners, how many dollars has the company borrowed or otherwise obligated itself for? A higher ratio means a company is relying more heavily on debt (and other obligations) relative to owner-contributed capital — which can amplify returns when things go well, but also amplifies losses and fixed payment obligations when they don’t. “Good” debt-to-equity levels vary enormously by industry — capital-intensive industries like utilities or real estate routinely run much higher ratios than, say, software companies, simply because of how their business models are financed.
Working Capital (Total Current Assets − Total Current Liabilities) isn’t a ratio but a dollar figure, and it’s worth calculating alongside the current ratio because it tells you the magnitude of the cushion in absolute terms, not just the proportion. A current ratio of 1.2 means very different things for a company with $10,000 of working capital versus one with $10 million — the ratio tells you the shape of the cushion, working capital tells you its size.
| Ratio | Formula | What It Measures | General Benchmark* |
|---|---|---|---|
| Current Ratio | Current Assets ÷ Current Liabilities | Near-term liquidity cushion | 1.5 – 3.0 |
| Quick Ratio | (Cash + Securities + AR) ÷ Current Liabilities | Liquidity excluding inventory | ≥ 1.0 |
| Debt-to-Equity | Total Liabilities ÷ Total Equity | Reliance on debt financing | Industry-dependent |
| Equity Ratio | Total Equity ÷ Total Assets | Share of assets funded by owners | Higher = more conservative |
| Working Capital | Current Assets − Current Liabilities | Absolute liquidity cushion | Positive, scaled to size |
*Benchmarks are general starting points, not universal rules — always interpret a ratio against the company’s own history and its industry peers, not against a single fixed number.
One important caveat ties this whole section together: ratios are most useful as comparisons, not as standalone verdicts. A current ratio of 1.8 in isolation tells you very little — but a current ratio that’s been steadily declining from 2.5 to 1.8 over several reporting periods tells you a great deal, and a current ratio of 1.8 compared against an industry average of 1.2 tells you something different again. That’s the bridge to our next and final how-to step: looking at these numbers not as a single snapshot, but as a sequence.

Calculate With Confidence
A dedicated financial calculator makes ratio work, present-value calculations, and amortization schedules far faster than a basic four-function calculator — useful well beyond just reading balance sheets.
Browse Financial CalculatorsComparing Periods and Benchmarking
This final step is where everything in this guide comes together — and it’s also the step that separates a casual glance from a genuine analysis. A single balance sheet is a photograph. Two or more balance sheets, placed side by side, become a flipbook — and flipbooks show you motion.
Plotting total assets, liabilities, and equity across periods turns three flat numbers into a trend line — and trend lines are where most real insight lives.
There are two complementary techniques worth knowing by name, because they’re the formal versions of what experienced readers do almost instinctively.
Horizontal analysis (also called trend analysis) compares the same line item across multiple periods, usually expressed as a percentage change. If accounts receivable grew 8% while revenue grew 6%, that’s a small but real divergence worth noting — receivables are growing slightly faster than the sales that generate them. If that same gap were 8% versus 35%, it would be a much bigger flag. Horizontal analysis is exactly why the comparative columns we identified back in Step 1 matter so much — without at least two periods, there’s no “horizontal” to analyze.
Vertical analysis (also called common-size analysis) takes a different approach: instead of comparing across time, it expresses every line item as a percentage of Total Assets within a single period. This is particularly powerful for comparing companies of different sizes — a $500,000 cash balance means something very different for a company with $1 million in total assets (50%) than for one with $50 million in total assets (1%). Converting the entire balance sheet to percentages of total assets puts companies of any size on the same visual footing, and makes shifts in a company’s own structure over time — say, inventory creeping from 15% of assets to 30% — much easier to spot than staring at raw dollar figures.
Benchmarking against peers is the natural extension of vertical analysis: once you’ve expressed a company’s balance sheet in percentage terms, you can compare those percentages against direct competitors or industry averages. A debt-to-equity ratio that looks alarming in isolation might be completely normal for that specific industry — and a ratio that looks fine in isolation might actually be unusually conservative (or aggressive) compared to peers. This is also where the choice of tools starts to matter: doing this kind of multi-period, multi-company comparison by hand in a notebook gets unwieldy fast, which is why most people doing serious financial analysis lean on spreadsheets. If you’re deciding between platforms for this kind of work, our comparison of Excel vs. Google Sheets covers the practical trade-offs, and if you’re managing the underlying bookkeeping that feeds these statements in the first place, our QuickBooks vs. Xero comparison walks through how each platform handles balance sheet reporting and period comparisons.
One last practical note on cadence: how often should you actually do this? For your own business, reviewing the balance sheet monthly or quarterly — alongside the income statement and cash flow statement — lets you catch shifts (a creeping receivables balance, a depleting cash cushion) while they’re still small and manageable. For companies you’re evaluating as an investor or lender, quarterly and annual filings give you the comparative data you need; the key discipline is actually doing the period-over-period comparison rather than just reading each new statement in isolation, since isolation is exactly where the “snapshot” framing from our introduction starts to mislead you.
At this point, you have a complete methodology: orient yourself, work through each section of assets and liabilities and equity with the right questions in mind, confirm the equation balances, calculate the ratios that matter, and compare across time and against peers. The next section takes a step back and looks at this from a slightly different angle — not “how do I read each section correctly,” but “what are the specific patterns that should make me slow down and look harder,” regardless of which section they show up in.