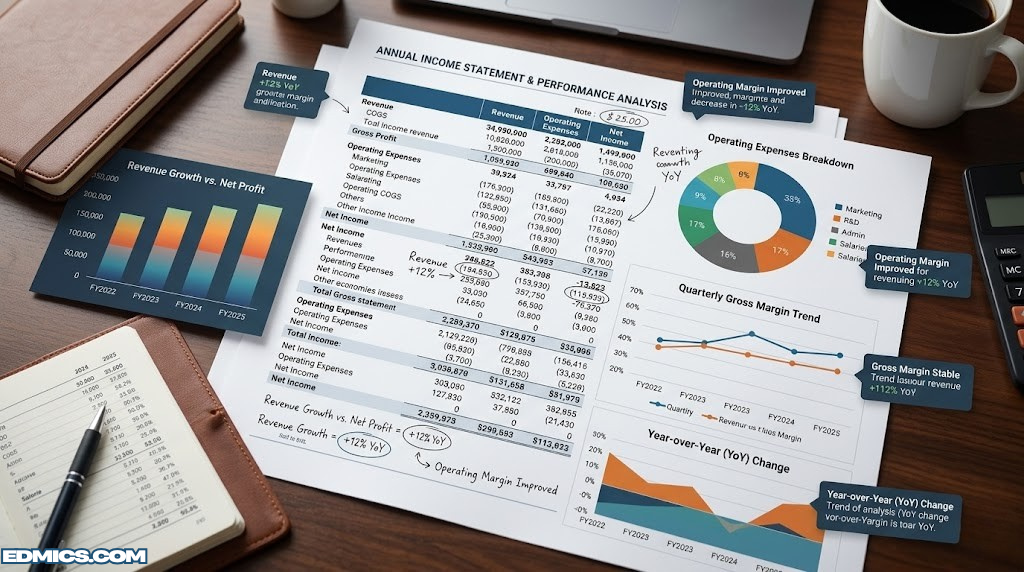
How to Read an Income Statement: Understand Every Line, Make Smarter Decisions
From revenue to net income — a complete, step-by-step guide to decoding the P&L statement that drives every financial decision.
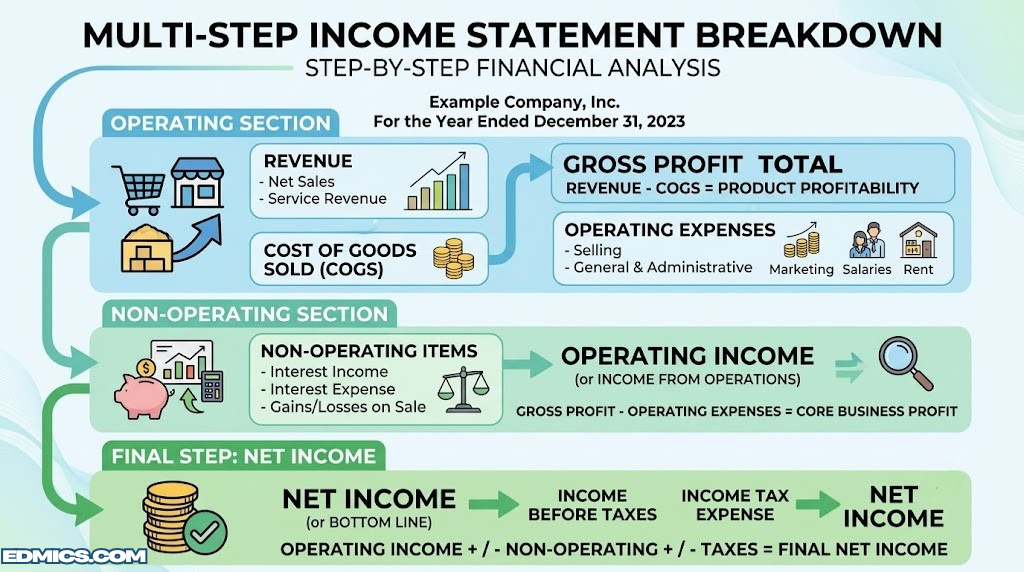
A multi-step income statement shows profitability in layers — from top-line revenue down to the all-important bottom line.
Every business decision — whether you’re a seasoned investor evaluating a stock, a manager scrutinizing department costs, or an entrepreneur seeking funding — eventually comes back to one document: the income statement. And yet, for many people, that document reads like a foreign language.
The income statement (also called a Profit & Loss statement, or simply “the P&L”) is the financial world’s report card for a business. It tells you whether a company made money, how much it made, where the money came from, and where it went. Once you know how to read it fluently, you gain an almost unfair advantage: you can separate truly healthy companies from ones that simply look good on the surface.
This guide will walk you through every section of an income statement in plain language — not textbook jargon. You’ll see step-by-step SVG diagrams for each stage, real-world context, and the critical ratio calculations that professional analysts use every day. Whether you’re reading the P&L of Apple, a local restaurant, or your own small business, the framework is identical.
If you’re building on this with a deeper understanding of accounting fundamentals, our accounting basics guide is an excellent starting point, and the golden rules of accounting will give you the structural principles that govern every line on this statement.
What Is an Income Statement — and Why Should You Care?
An income statement is a formal financial report that summarizes a company’s revenues, expenses, and profits (or losses) over a defined period of time — typically a fiscal quarter or an entire year. It is one of the three core financial statements, alongside the balance sheet and the cash flow statement.
While the balance sheet takes a snapshot of what a company owns and owes at a specific moment, the income statement tells a story. It shows you the movie, not just a still frame: here is how we performed, how efficiently we operated, and whether we created or destroyed value during this period.
Why It Matters for Different Audiences
The income statement serves different purposes depending on who is reading it:
- Investors and analysts use it to assess profitability trends, earnings quality, and whether a company’s core business is actually growing in a sustainable way.
- Business owners and managers use it to track which product lines or departments are profitable, identify cost overruns, and guide operational decisions.
- Lenders and creditors examine it to determine whether a company generates enough income to service its debt obligations.
- Employees and partners can glean the financial health and stability of an organization before entering into long-term commitments.
Understanding the income statement is also a gateway to smarter personal wealth decisions. When you can read a company’s P&L, you can evaluate investments with real evidence rather than headlines. Pair this with a solid grasp of where to put your money and you have a genuinely powerful toolkit.
💡 Key Insight
The income statement answers the single most important question in business: Is this company making money from its core operations — and is that improving over time?

Recommended Tool
HP 12CP Financial Calculator — the Analyst’s Standard
Calculate EPS, margin ratios, and discounted cash flows with the same tool used by finance professionals worldwide.
View on AmazonTypes of Income Statements: Single-Step vs Multi-Step
Before diving into reading line items, you need to recognize which format you’re looking at. There are two main structures an income statement can take, and they communicate very different levels of information.
Single-Step Income Statement
The single-step format is the simpler of the two. It lumps all revenues together, then subtracts all expenses in one clean calculation to arrive at net income. Small businesses and sole proprietors often use this format because it’s quick to prepare and easy to understand.
The limitation? It tells you whether you made money but not where in the business the profit or loss originated. It’s like getting a final exam score without seeing which questions you got right or wrong.
Multi-Step Income Statement
The multi-step format, used by virtually every public company and any business of meaningful size, breaks profitability into distinct stages. Each stage peels back another layer and reveals a specific dimension of financial performance. This is the format you’ll encounter when analyzing any major corporation — and it’s the one we’ll spend most of this guide focused on.
The multi-step structure lets you ask sharper questions: Are the margins on our core product strong? Are operating costs eating our gross profit? Is net income being propped up by one-time asset sales while the core business struggles? These answers simply are not visible in a single-step statement.
✓ Multi-Step Strengths
- Reveals profitability at multiple stages
- Separates operating from non-operating income
- Enables meaningful ratio analysis
- Standard for public companies (GAAP / IFRS)
✗ Multi-Step Limitations
- More complex to prepare and read
- Classification choices vary by company
- Does not reflect cash movements
- Can mask timing issues vs. cash flow
Reading an Income Statement: Step-by-Step
Identify the Revenue (Top Line)
Revenue — also called sales, net sales, or turnover — is the first line on any income statement. It represents the total amount of money a company earned from its primary business activities during the period: selling products, delivering services, or licensing intellectual property. This is why analysts call it the “top line.”
But even at this first step, nuance matters. Revenue is not cash received — it’s income earned. Under accrual accounting (the standard for any company following GAAP), revenue is recognized when a sale is made, not when the customer pays. A company can report $10 million in revenue and still be running out of cash if its customers are slow to pay.
When studying revenue, ask three questions:
- Is it growing? Consistent year-over-year growth signals healthy demand and market expansion.
- Is it diversified? Revenue concentrated in one customer, product, or geography is riskier.
- How is it being recognized? Particularly in software and subscription businesses, revenue recognition policies can dramatically affect what the statement reports.
✓ What to Look For
Strong, consistent revenue growth over multiple periods — not just one-time spikes from asset sales or accounting adjustments — is one of the healthiest signals on an income statement.
Identify Cost of Goods Sold (COGS)
Directly beneath revenue, you’ll find Cost of Goods Sold — abbreviated as COGS, or sometimes called Cost of Revenue or Cost of Sales. This line represents the direct costs of producing the goods or services that generated that revenue. For a manufacturer, COGS includes raw materials and factory labor. For a retailer, it’s the wholesale price of inventory. For a software company, it might include hosting costs and customer onboarding.
What COGS does not include: executive salaries, marketing budgets, office rent, or any overhead that doesn’t tie directly to production. Those belong in operating expenses further down.
The relationship between COGS and Revenue gives you the most fundamental profitability signal: the gross margin. A company that generates $12 million in revenue but spends $11 million producing its products has almost nothing left over to cover any other cost. In contrast, a software company might generate $12 million in revenue with only $2 million in COGS — giving it the financial cushion to invest heavily in sales, marketing, and R&D.
This is why understanding COGS is essential to evaluating a business model, not just its output. For more on how these figures connect to your broader understanding of accounting equations, the link between assets, liabilities, and equity gives important structural context.
Calculate and Interpret Gross Profit
Gross profit is simply Revenue minus COGS. It tells you how much money is left after the business covers the direct costs of what it sells — before any overhead, marketing, management, or taxes enter the picture.
The gross profit margin percentage is one of the most telling ratios in all of financial analysis. It reveals how efficiently the company converts revenue into profit at the production level.
A gross margin of 41.9% means the business retains roughly 42 cents of every dollar of revenue after covering direct production costs. Is that good? That depends entirely on the industry. The only meaningful comparison is against the company’s own historical margins and its closest competitors.
| Industry | Typical Gross Margin Range | Why It’s High/Low |
|---|---|---|
| Software / SaaS | 65–85% | Near-zero marginal cost of delivering software |
| Pharmaceuticals | 60–80% | High-value IP with low per-unit production cost |
| Consumer Brands | 40–60% | Brand premium over commodity input costs |
| Manufacturing | 25–45% | Material and labor costs are substantial |
| Retail (General) | 25–40% | Inventory markups on commodity goods |
| Grocery / Food Retail | 15–25% | Thin markups on high-volume, perishable goods |
| Construction | 15–25% | High material and subcontractor costs |

Analyst’s Resource
Financial Accounting Ledger — Track Every Line Item
Professional columnar pads and analysis notebooks for tracking P&L line items, ratios, and comparison notes.
View on AmazonAnalyze Operating Expenses (OpEx)
Operating expenses are the costs a company incurs to run its business that are not directly tied to production. This is where you’ll see how the company invests in its own growth and infrastructure. Operating expenses typically include several sub-categories that analysts examine independently.
SG&A (Selling, General & Administrative)
This is the catch-all for overhead: executive compensation, rent on offices, legal fees, accounting services, human resources, IT, and general corporate expenses. SG&A is often the largest operating expense line and is a key area where management’s operational discipline is tested. A company whose SG&A is growing faster than its revenue is spending more to generate each dollar of sales — a warning sign worth monitoring.
R&D (Research and Development)
Technology, pharmaceutical, and innovation-driven companies invest heavily in R&D to develop new products or improve existing ones. These expenses are critical for future revenue but are a drag on near-term profitability. Analyzing R&D spend relative to revenue can tell you whether a company is prioritizing future growth or maximizing today’s earnings.
Depreciation and Amortization (D&A)
One of the most conceptually important items on the income statement — and one that confuses many first-time readers — is depreciation and amortization. These are non-cash charges that spread the cost of an asset over its useful life. If a company buys a $5 million piece of factory equipment expected to last 10 years, it doesn’t expense the full $5 million in year one. Instead, it depreciates $500,000 each year for a decade. Understanding this is key to understanding why EBITDA (explained in Step 5) exists as a metric.
The significance of depreciation in accounting extends beyond just one line — it affects everything from asset valuation on the balance sheet to cash flow analysis.
Read Operating Income (EBIT and EBITDA)
Operating income — also called Earnings Before Interest and Taxes, or EBIT — is the profit a company generates purely from its core business operations, after deducting both COGS and operating expenses from gross profit. This is the line that answers the most fundamental question about a business model: is the core business profitable on its own?
Operating margin is one of the most-watched metrics in financial analysis because it isolates core business efficiency from financing decisions (interest) and tax strategy. A company can have a low net income margin due to heavy debt (high interest payments) while still having an excellent operating margin — suggesting the underlying business is strong even if the balance sheet needs work.
Understanding EBITDA
EBITDA (Earnings Before Interest, Taxes, Depreciation, and Amortization) is derived by adding back non-cash depreciation and amortization charges to EBIT. It’s widely used in business valuation, particularly in private equity and mergers and acquisitions, because it approximates cash earnings from operations and allows companies with very different asset structures to be compared on a more level playing field.
However, EBITDA is not a GAAP-approved metric and can be misleading. A company with heavy capital expenditure needs (like a railroad or a semiconductor fab) cannot simply ignore depreciation — those assets genuinely wear out and must be replaced. Warren Buffett has famously called excessive EBITDA focus misleading for capital-intensive businesses.
⚠ Watch Out
When a company reports only EBITDA and avoids discussing net income, that’s a yellow flag. EBITDA before everything is often used to make profitability look better than it is. Always reconcile it back to GAAP earnings.
Understand Non-Operating Income and Expenses
After operating income, the income statement introduces a category of items that have nothing to do with the company’s core business: non-operating income and expenses. These typically include interest income (from cash and short-term investments), interest expense (on debt), gains or losses from investments, and occasionally large one-time items like the sale of a division or a lawsuit settlement.
The critical skill here is learning to distinguish between recurring non-operating items and one-time events. Interest income and expense recur each period. A gain from selling a business division is a one-time windfall — it tells you nothing about future performance. When analysts calculate “adjusted” or “normalized” earnings, they strip out these one-time items to get a cleaner picture of ongoing profitability.
Interest expense also reveals something about capital structure. A company carrying heavy debt will have substantial interest charges that reduce pre-tax income significantly. Analysts often examine the interest coverage ratio (Operating Income ÷ Interest Expense) to assess whether the business can comfortably service its debt. A ratio below 2.0x is considered concerning for most industries.
Arrive at Pre-Tax Income and Net Income (The Bottom Line)
After accounting for non-operating items, you arrive at Pre-Tax Income (also called Earnings Before Tax, or EBT). From this, the income tax provision is subtracted — and what remains is net income. This is “the bottom line” that headlines reference when they report a company’s quarterly earnings.
Net income is what gets reported in media coverage of company earnings. It’s the number that flows to the balance sheet (into retained earnings) and is used to calculate earnings per share (EPS). However, net income can be influenced by accounting choices, tax strategies, one-time items, and non-cash charges in ways that operating income cannot — which is why sophisticated investors never look at net income in isolation.
The net profit margin (Net Income ÷ Revenue) is the ultimate test of overall profitability, but only after you’ve verified that net income isn’t being inflated by one-time gains or distorted by aggressive accounting. This is also why comparing the income statement against the cash flow statement is so important — cash doesn’t lie the way accrual accounting can.
Understand Earnings Per Share (EPS) and Key Ratios
The final section of a public company’s income statement typically reports Earnings Per Share (EPS) — both basic and diluted. EPS divides net income by the number of shares outstanding, giving investors a per-share profitability metric that can be compared across periods or used to calculate the price-to-earnings (P/E) ratio.
Basic EPS uses the current share count. Diluted EPS is the more conservative figure — it includes all securities that could be converted into shares (options, warrants, convertible notes). Diluted EPS is the figure most analysts and investors use, because it represents the “worst case” dilution to shareholders.
If you are studying stocks for investment purposes, pairing your EPS analysis with broader investment context — such as the differences between index funds vs mutual funds, ETFs, and stocks vs. bonds — gives you the complete framework for evaluating opportunities intelligently.

Finance Students & Analysts
Texas Instruments BA II Plus — The CFA Standard
Calculate EPS, NPV, IRR, and every financial ratio covered in this guide. The BA II Plus is the approved calculator for the CFA, CFP, and CPA exams.
Shop on AmazonIncome Statement Red Flags: What Every Reader Must Know
Reading an income statement is not just about understanding what each line means — it’s about spotting the signals that tell you something is wrong beneath the surface. The following are the most important red flags that experienced analysts and investors look for when reviewing a company’s P&L.
1. Revenue Growing Without Corresponding Cash Flow
When a company’s revenue is rising rapidly but its operating cash flow isn’t keeping pace, it may be recognizing revenue aggressively — booking sales before customers have actually paid. This was a core issue in several high-profile accounting scandals. Always compare revenue growth to cash receipts on the cash flow statement.
2. Shrinking Gross Margins
A declining gross margin over multiple periods is one of the most serious warnings in financial analysis. It can indicate rising input costs the company can’t pass on to customers, intensifying price competition, or a deteriorating product mix. When margins compress, a business must grow revenue faster just to maintain the same absolute profit — an increasingly difficult treadmill.
3. SG&A Expenses Outpacing Revenue
If overhead costs are growing at 20% while revenue grows at only 10%, the business is becoming structurally less efficient. Every dollar of revenue is costing more to generate. This is particularly concerning when the company frames it as “investing in growth” without providing evidence that the spending will convert to future revenue.
4. Recurring “Non-Recurring” Charges
Companies frequently report restructuring charges, impairment write-downs, and severance costs as “one-time” or “non-recurring” items. When these appear year after year, they are clearly not exceptional — they are part of the normal cost of running the business and should be treated as such in any earnings calculation. This is one of the many reasons financial audits play such a critical governance role.
5. Net Income Propped Up by Non-Operating Income
A company whose operating income is flat or declining but whose net income is growing because it sold an asset, received a legal settlement, or booked investment gains is masking operational weakness. Strip out non-operating income and examine core operating performance independently.
6. Very High Effective Tax Rate Swings
Large, unexpected changes in the effective tax rate can dramatically alter net income in ways unrelated to business performance. A company that shows a big improvement in net income primarily because of a tax benefit (like releasing a valuation allowance on deferred tax assets) needs careful scrutiny.
⚠ The Golden Rule
Never analyze an income statement in isolation. It must always be read alongside the balance sheet, the cash flow statement, and the notes to the financial statements — which often contain the most important disclosures.
Comparing Income Statements Across Companies and Time
A single income statement read in isolation tells you only part of the story. The real insight comes from comparison: against the company’s own historical results (trend analysis) and against its industry peers (competitive benchmarking).
Horizontal Analysis (Trend Over Time)
Horizontal analysis examines how each line item changes as a percentage from one period to the next. This reveals growth rates, accelerating or decelerating trends, and the relationship between revenue and cost growth over time.
| Line Item | Period 1 | Period 2 | Change ($) | Change (%) | Signal |
|---|---|---|---|---|---|
| Revenue | $10.8M | $12.4M | +$1.6M | +14.8% | Strong growth ✓ |
| COGS | $6.5M | $7.2M | +$0.7M | +10.8% | Managed below rev growth ✓ |
| Gross Profit | $4.3M | $5.2M | +$0.9M | +20.9% | Margin expanded ✓ |
| Operating Expenses | $2.4M | $2.9M | +$0.5M | +20.8% | Watch — grew with GP |
| Operating Income | $1.9M | $2.3M | +$0.4M | +21.1% | Improving ✓ |
| Net Income | $1.2M | $1.5M | +$0.3M | +25.0% | Solid improvement ✓ |
Vertical Analysis (Common-Size Statements)
Vertical analysis expresses every line item as a percentage of revenue. This is called a “common-size” income statement and is invaluable for comparing companies of very different sizes. It answers: for every dollar of revenue, how much goes to COGS? How much to SG&A? How much is left as net income?
| Line Item | Amount | % of Revenue | Industry Avg | Assessment |
|---|---|---|---|---|
| Revenue | $12,400,000 | 100.0% | 100.0% | — |
| COGS | ($7,200,000) | 58.1% | 56.0% | Slightly above avg |
| Gross Profit | $5,200,000 | 41.9% | 44.0% | Slightly below avg |
| SG&A | ($1,900,000) | 15.3% | 18.0% | Well controlled ✓ |
| R&D | ($650,000) | 5.2% | 4.5% | Slightly above avg |
| D&A | ($350,000) | 2.8% | 3.0% | In line ✓ |
| Operating Income | $2,300,000 | 18.5% | 19.5% | Near industry avg |
| Net Income | $1,496,500 | 12.1% | 11.0% | Above average ✓ |
Together, horizontal and vertical analysis give you a complete multi-dimensional view of financial performance. These frameworks are also central to broader financial planning, whether you are managing a business or building personal wealth. For those curious about how double-entry bookkeeping generates the numbers that eventually appear on the income statement, that connection provides essential foundational context.

Small Business Owners
QuickBooks — Generate Your Own Income Statement
Automatically produce P&L reports, track revenue by product line, and compare periods side by side. The most widely used small business accounting platform.
View on AmazonTools and Resources for Income Statement Analysis
You don’t need a Bloomberg terminal to conduct meaningful income statement analysis. A growing ecosystem of tools makes financial data accessible to anyone willing to dig in.
For Investors Analyzing Public Companies
Free platforms like Macrotrends, Wisesheets, Stock Analysis, and TIKR Terminal provide multi-year income statement histories with built-in ratio calculations. These eliminate manual data entry and let you focus on interpretation. Many of the best analysts also still work in spreadsheets — combining downloaded financial data with their own custom models in Excel or Google Sheets.
For Business Owners and Managers
Accounting software is the front line of income statement generation. QuickBooks vs Xero is the classic comparison at this tier — both generate professional P&L reports with a few clicks and can break revenue and expenses down by product, department, or location. For companies that need to track budgets against actuals, QuickBooks vs FreshBooks covers the spectrum from enterprise to freelancer needs.
For Tax Time
The net income figure on the income statement feeds directly into your tax filings. Platforms like TurboTax vs H&R Block and TurboTax vs FreeTaxUSA can help you navigate from your P&L to your tax return, particularly for self-employed filers and small business owners who need to report business income accurately.
Personal Finance and Budgeting
Understanding income statements at the corporate level also sharpens your personal financial thinking. Tools like Mint vs YNAB and Personal Capital vs Mint essentially apply income statement logic to your household — tracking income, expenses, and what remains. The discipline of separating “revenue” (income) from “COGS” (essential costs) from “operating overhead” (discretionary spending) is directly applicable to personal budgeting.
Revenue
Total income from primary business activities before any deductions
COGS
Direct costs of producing goods or services sold
Gross Profit
Revenue minus COGS; reveals production-level efficiency
SG&A
Selling, general & administrative overhead costs
EBIT
Earnings Before Interest & Taxes; pure operating profit
EBITDA
EBIT plus non-cash D&A charges; common valuation metric
Net Income
Final profit after all expenses, interest, and taxes
EPS
Earnings Per Share; net income divided by shares outstanding
A Complete Multi-Step Income Statement Example
Bringing everything together, here is a fully labeled multi-step income statement showing all the sections covered in this guide, with every major metric calculated alongside:
| Line Item | Amount (USD) | % of Revenue | Key Metric |
|---|---|---|---|
| Revenue (Net Sales) | $12,400,000 | 100.0% | — |
| Cost of Goods Sold (COGS) | ($7,200,000) | 58.1% | COGS Ratio |
| Gross Profit | $5,200,000 | 41.9% | Gross Margin: 41.9% |
| Operating Expenses: | |||
| Selling, General & Admin (SG&A) | ($1,900,000) | 15.3% | — |
| Research & Development (R&D) | ($650,000) | 5.2% | — |
| Depreciation & Amortization (D&A) | ($350,000) | 2.8% | Non-cash |
| Total Operating Expenses | ($2,900,000) | 23.4% | — |
| Operating Income (EBIT) | $2,300,000 | 18.5% | Op. Margin: 18.5% |
| Non-Operating Items: | |||
| Interest Income | $50,000 | 0.4% | — |
| Interest Expense | ($300,000) | 2.4% | Coverage: 7.7x |
| Pre-Tax Income (EBT) | $2,050,000 | 16.5% | — |
| Income Tax Provision (27%) | ($553,500) | 4.5% | Eff. Rate: 27% |
| NET INCOME (Bottom Line) | $1,496,500 | 12.1% | Net Margin: 12.1% |
| Basic EPS | $1.50 | — | Shares: ~998,333 |
| Diluted EPS | $1.43 | — | Diluted shares: ~1.05M |
| EBITDA | $2,650,000 | 21.4% | EBITDA Margin: 21.4% |
This table represents a healthy, mid-sized company with strong revenue growth, disciplined cost management, and solid profitability across all margin layers. The interest coverage ratio of 7.7x (EBIT of $2.3M ÷ interest expense of $300K) means the business can comfortably cover its debt obligations. Net income is not reliant on one-time items. All three margin rates — gross, operating, and net — are competitive within typical manufacturing or consumer goods benchmarks.
For deeper context on how these figures are constructed from the ground up through double-entry bookkeeping, and how they connect with a company’s broader balance sheet position, those guides provide the complete picture of financial statement literacy.
Students & Finance Learners
Casio FC-200V Financial Calculator — Ratios & Interest
Purpose-built for financial calculations including margin analysis, compound interest, cash flow valuation, and breakeven analysis.
Shop on AmazonIncome Statement FAQs
Putting It All Together: Your Income Statement Playbook
Reading an income statement is a skill, and like any skill, it improves with practice. The steps covered in this guide give you a complete, systematic framework: start at the top line (revenue), work through gross profit, operating expenses, and operating income, then navigate the non-operating items and taxes to arrive at the bottom line.
But the true power of this skill isn’t in reading a single statement — it’s in reading multiple statements over time, comparing them against peers, and triangulating with the cash flow statement and balance sheet to build a complete picture of financial health. No single number tells the full story. EBITDA without cash flow is incomplete. Net income without operating income context is misleading. Revenue without margin analysis is hollow.
Whether your goal is to invest more intelligently — perhaps applying insights from wealth management strategies, real estate investing, or dividend-paying stocks — or to run your own business more effectively with better financial strategic planning, the income statement sits at the center of every financial decision worth making.
Master it, and you’ll never look at a company’s earnings report the same way again.
Ready to Deepen Your Financial Literacy?
Explore our complete guides on the balance sheet, cash flow statement, and accounting fundamentals — or jump straight to investment strategy with our curated financial resources.
Explore Accounting Basics →
Level Up Your Skills
Financial Intelligence — The Business Book for Non-Financial Managers
Karen Berman’s classic guide teaches you to read and understand financial statements with confidence. One of the most highly rated finance books for non-accountants.
View on Amazon